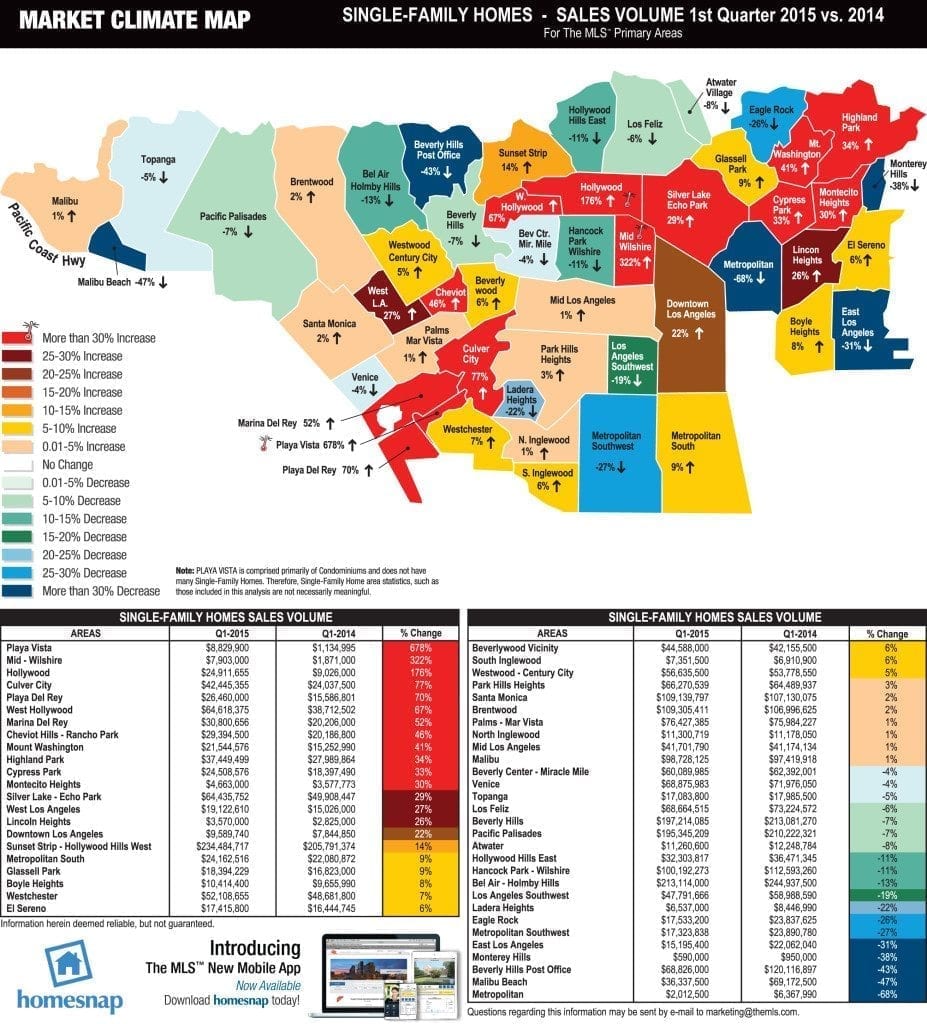
The MLS just released the First Quarter Market Climate Map for the Greater Los Angeles Area. This map and chart (See below) compare the LA sales volume of single-family homes from the first quarter of 2014 to the first quarter of 2015 in the different areas of Los Angeles. Click on the image below to zoom in.

If you would like more information about the current real estate market in your neighborhood, or would like a obligation free home value quote, please do no hesitate to contact me!
I hope you enjoyed this blog. Keep in the loop for the LA real estate market by following us on Facebook.


Leave A Comment